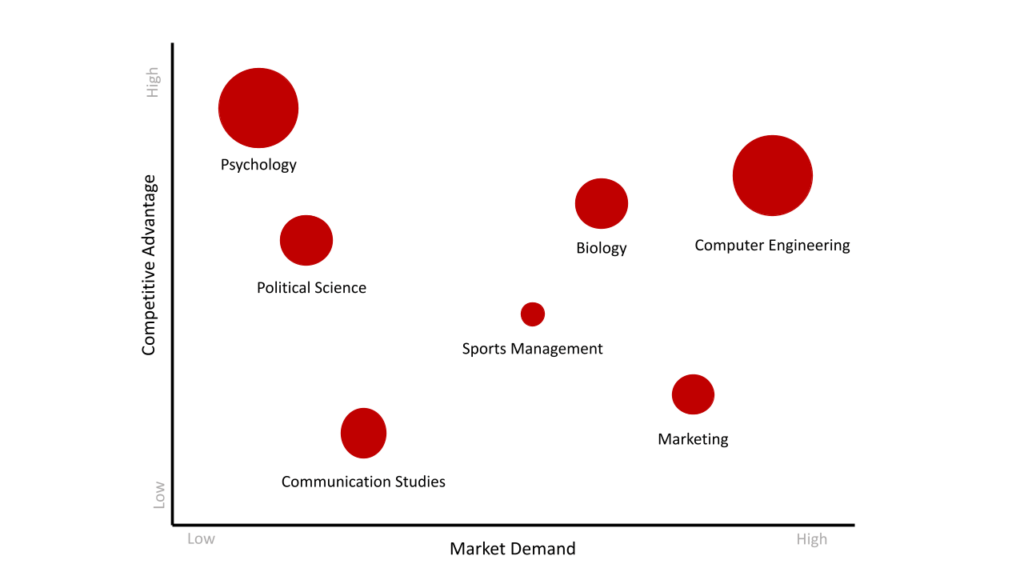
Thriving institutions are expert managers of their academic portfolios. They understand how their portfolio performs relative to student demand, enrollment trends, student success, and net revenue. In addition, institutions must overlay that look with an understanding of market demand and competition.
A market scan addresses two key questions:
-
How well does your academic portfolio align with market demand, both in-state and nationally?
-
How does your portfolio of program offerings compare to institutional peers?

The scatterplot shows how academic programs can be mapped based on market demand and competitive advantage. The horizontal axis indicates market demand, or how in-demand degrees in those programs are in the labor market. The vertical axis indicates the competitive advantage of the program at the institution modeled relative to peer institutions. The size of the bubbles indicates the size of the academic program (headcount) at the institution modeled.
At rpk, we match Classification of Instructional Program (CIP) codes (as defined by the National Center for Education Statistics) with Bureau of Labor Statistics data to create unique pairings that measure market demand. We then collaborate with institutions to identify appropriate peers for competitor analysis. We recently completed these analyses at a large, R1 institution and a medium-sized regional comprehensive institution, and while the results are not publicly available, below are three of the many lessons learned:
1. Align Market and Mission
rpk has always encouraged clients to review academic portfolios with the three ‘Ms’ in mind: Mission, Market, and Margin®. However, in tough economic times, it can be tempting to narrow in on market and margin. During the market scan, a recent client realized that despite low enrollment in their Indigenous Studies program, they were one of the few institutions among national and regional peers to offer it. Given the institution’s proximity to Indigenous communities and its mission to serve minoritized populations, they realized they have a significant opportunity to invest in and grow this program.
2. Identify Portfolio Holes, but Expand with Caution
Many clients ask us what new things they can add to their portfolio to attract new students and meet labor market demand. The desire to grow is understandable, and institutions need to be thinking entrepreneurially about new opportunities, but they should do so carefully. According to a new report by Burning Glass Technologies, 30% of new programs fail to produce graduates within five years, and the cost of that failure is high. We see about two-thirds of students concentrate in 10-12 majors, meaning there are dozens (and sometimes hundreds) of programs with enrollments of ten or fewer students. We caution clients to approach new programs with clear enrollment goals and well-defined exit strategies if they fail to meet them.
3. Think Beyond Adding and Cutting
When discussing portfolio health, it’s common to focus only on what needs to be added or cut. However, other strategies include forming strategic industry partnerships to benefit graduates in specific programs, re-evaluating program names or curriculum to better align to the workforce, or establish differentiation from the rest of the market, or right-sizing department budgets and personnel to offer lower-enrolled programs at a lower expense to the institution.
While no silver bullet (or, in our case, silver analysis) exists to precisely optimize the academic portfolio in a way that achieves financial sustainability, assessing market demand and industry competition is an excellent initial step

