By Rilie Kafer
Across rpk’s work with over 200 higher education institutions, one thing has always held true: some academic program offerings demonstrate much higher demand from students. While this might seem obvious, the extent to which students concentrate in certain programs can be surprising to institutions when they first begin measuring and monitoring the distribution of student enrollments throughout the catalog of degree programs (academic portfolios). The surprise comes not because institutions think all programs are the same size, but because the concentration of enrollment in the largest programs can be quite significant, leaving relatively fewer students enrolled in the majority of programs. Leaders quite rightly end up wanting to know: “Is this amount of concentration normal? Is it good? Is it bad? And what should I do (or not do) about it?”
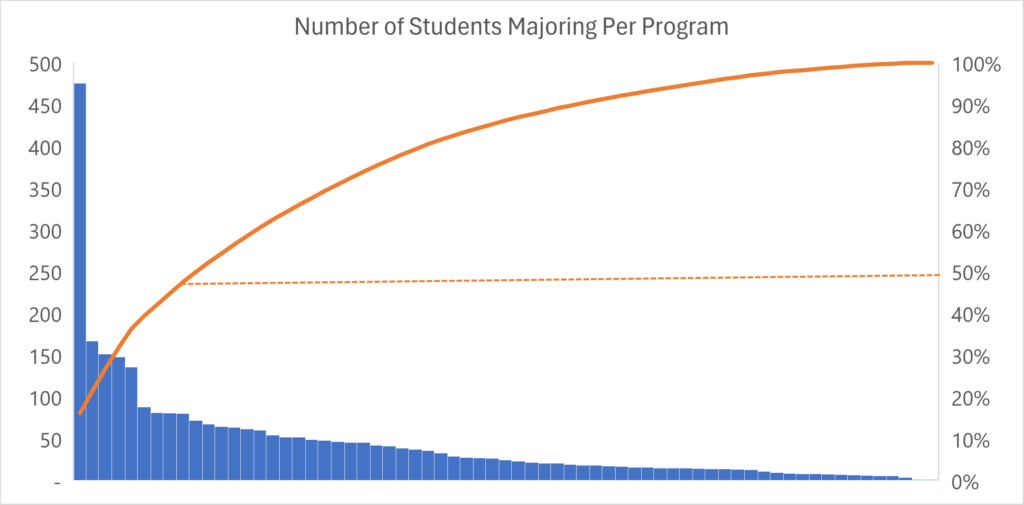
First, let’s visualize what we mean by program enrollment concentration. Below is a real dataset from a deidentified institution that looks at program enrollment concentration. The institution has an academic portfolio of 67 undergraduate programs, and an undergraduate student population of approximately 3,000 students. When counting the number of students enrolled or “majoring” in a program and ordering programs in descending order by size, we can quickly see that approximately 50% of students are majoring in their 10 largest undergraduate programs, while the other 50% of majors are distributed among the remaining 57 majors.
Now the question arises: is concentration normal? Is it inherently good or bad? The answer is nuanced. Concentration indicates program demand, but it doesn’t indicate why the program has high demand. Perhaps this program is an area of particular market strength or expertise for the institution, or perhaps the program reflects long standing, national trends (meaning, a program that shows high demand at most institutions).
While the question of whether or not concentration is good for an institution is nuanced, what is clear (and becoming clearer still as institutions move forward with widespread program closure) is that it’s more and more difficult to justify supporting a robust portfolio of program offerings that enroll few students.
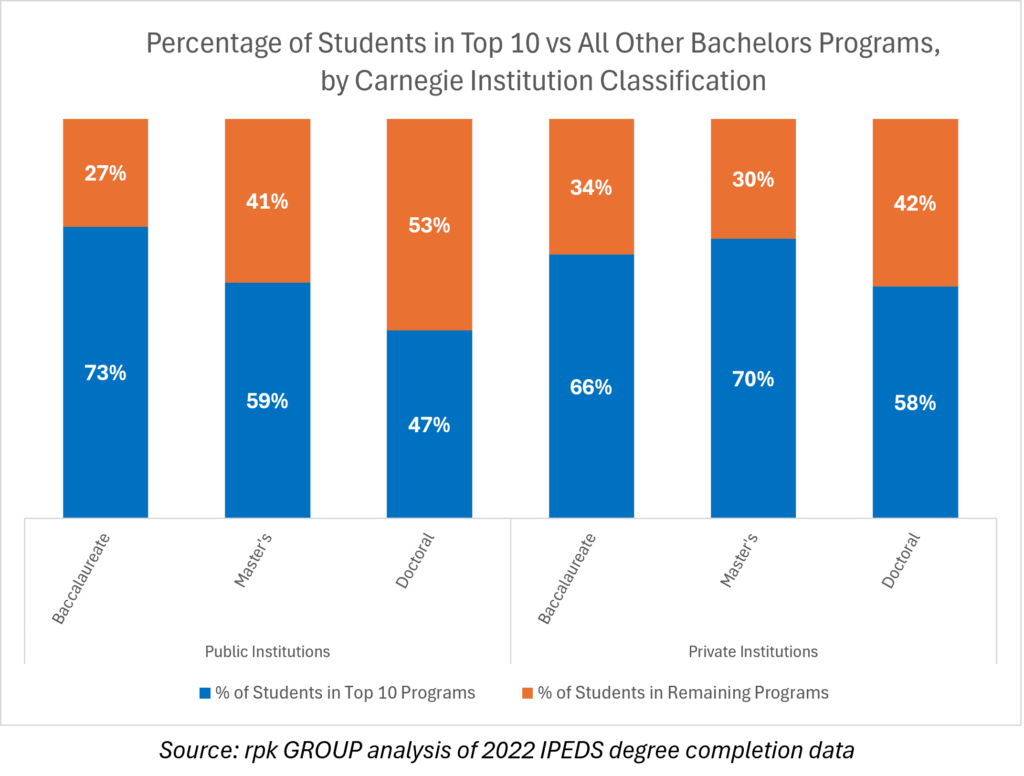
To better understand the prevalence and magnitude of this phenomenon, rpk analyzed national data from the Integrated Postsecondary Education Database System (IPEDS). Specifically, the analysis considered public and private non-profit 4-year institutions’ bachelor’s degree conferrals in 2018 and 2022 by program. As in the graphic above, we ranked the programs in order of size by institution and asked, “What percentage of students graduated from the 10 largest bachelor’s programs at each institution?” The findings confirmed the existence of significant program concentrations across sectors.
- Private non-profit 4-year institutions’ academic portfolios contained 44 programs on average, and 62% of students completed their degrees in the 10 largest programs. The remaining 38% of students graduated from the other 34 academic programs.
- Similarly, public 4-year institutions average 67 programs in their portfolios and saw 50% of students graduating from the top 10 programs, with 50% of students graduating from the remaining 57 programs.
- Larger portfolios like those found in public doctoral institutions exhibit less concentration in their largest programs. While only 47% of students are enrolled in their top 10 programs, it’s still notable that the remaining 53% of conferrals are spread among an average of 72 programs.
- These concentrations for both types of institutions were unchanged between 2018 and 2022.
Certain programs consistently emerge as high demand choices across institutions, and institutions should be aware of these national trends as they consider programmatic decisions.
- Program categories that appear in the top 10 largest programs with the most frequency are psychology, nursing, business, biology, criminal justice, and mechanical engineering.
- Another way to understand program demand is to look at the total conferrals by program across all institutions. When we do that, the list above matches total conferrals with the additions of computer science, political science, and elementary education.
Given how common compressions are within academic portfolios, institutions should carefully monitor their academic offerings to be aware of trends in program concentration and ensure that resources are allocated appropriately in support of student demand. This review of program concentration should also consider net revenue generation by program and/or department, as well as mission alignment and other contributions of the discipline (research, general education, and service, to name a few). In this way, institutions can ensure a sustainable business model and generate resources for reinvestment in critical mission needs that require subsidization.