Making changes can be a difficult process. We know that. Data-informed changes can lower the difficulty hurdle by increasing transparency and establishing baseline metrics to measure impact.
At rpk, we work to always address the ‘why’ question with our college and university partners. Why do we believe that there is opportunity for higher education as an industry to get more from the resources it already has? Reviewing a decade’s (2010-2020) worth of data related to spending patterns at private and public four-year higher education institutions tells that story.
First, the old news: Spending per student continues to increase across private and public four-year institutions. Looking at just public four-year institutions, average increases in spending per student were over 10%.
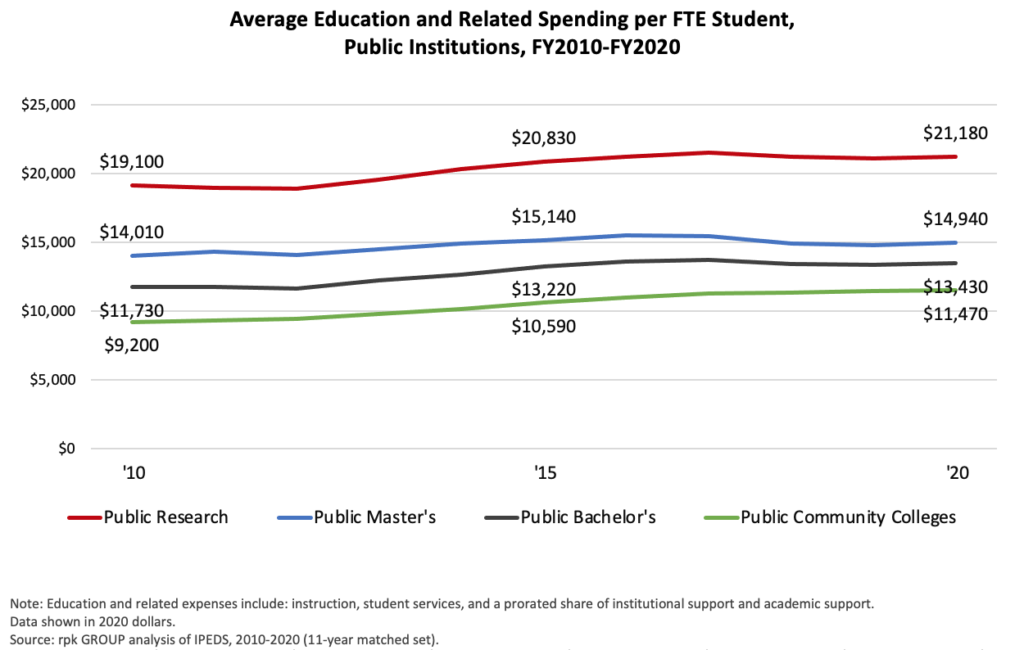
Increases in spending aren’t necessarily a bad thing. What’s problematic is not fully understanding the impact, or the return on investment related to spending increases.
This brings us to the encouraging news: As more students are graduating, the cost per student completion is improving for public institutions across all sectors of higher education. Below, you can see the decade-long trend.
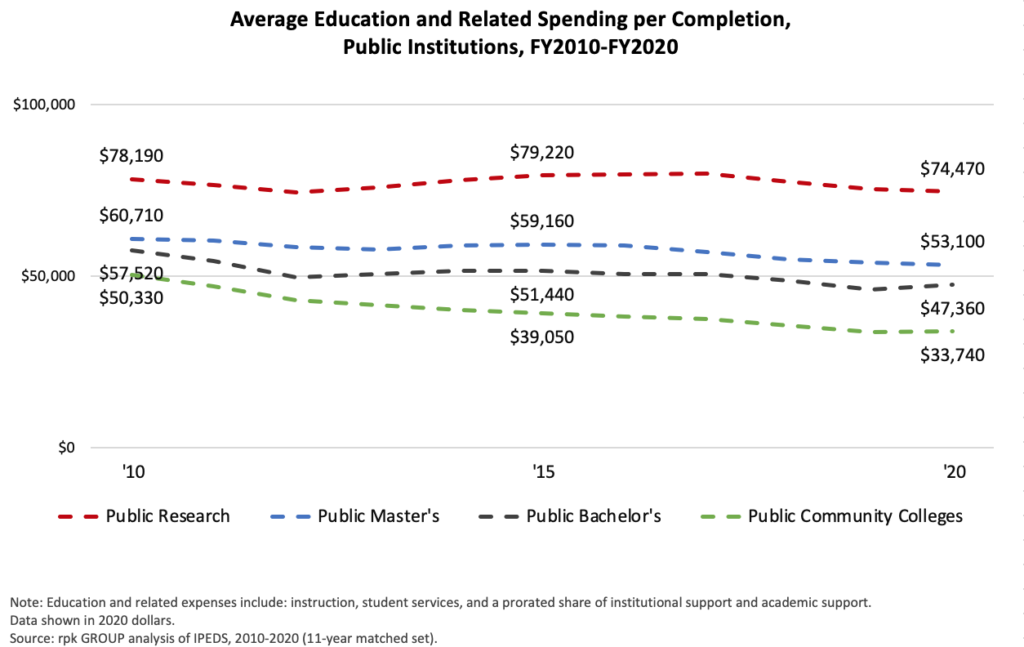 Combining an understanding of spending with productivity allows for a new framing of return on investment. This can be further deepened by disaggregating completions by race/ethnicity.
Asking and answering questions such as “Are all students completing with the same rate of success?” and “If not, what actions need to be taken to improve success?” is a crucial step in higher education—one that will enable us to structure sustainable financial models that ensure access and attainment for all.